Spend
The ledger by any dimension — provider, model, workflow, workload, team, agent, metering, status, day — with the change against the window before, both windows named.
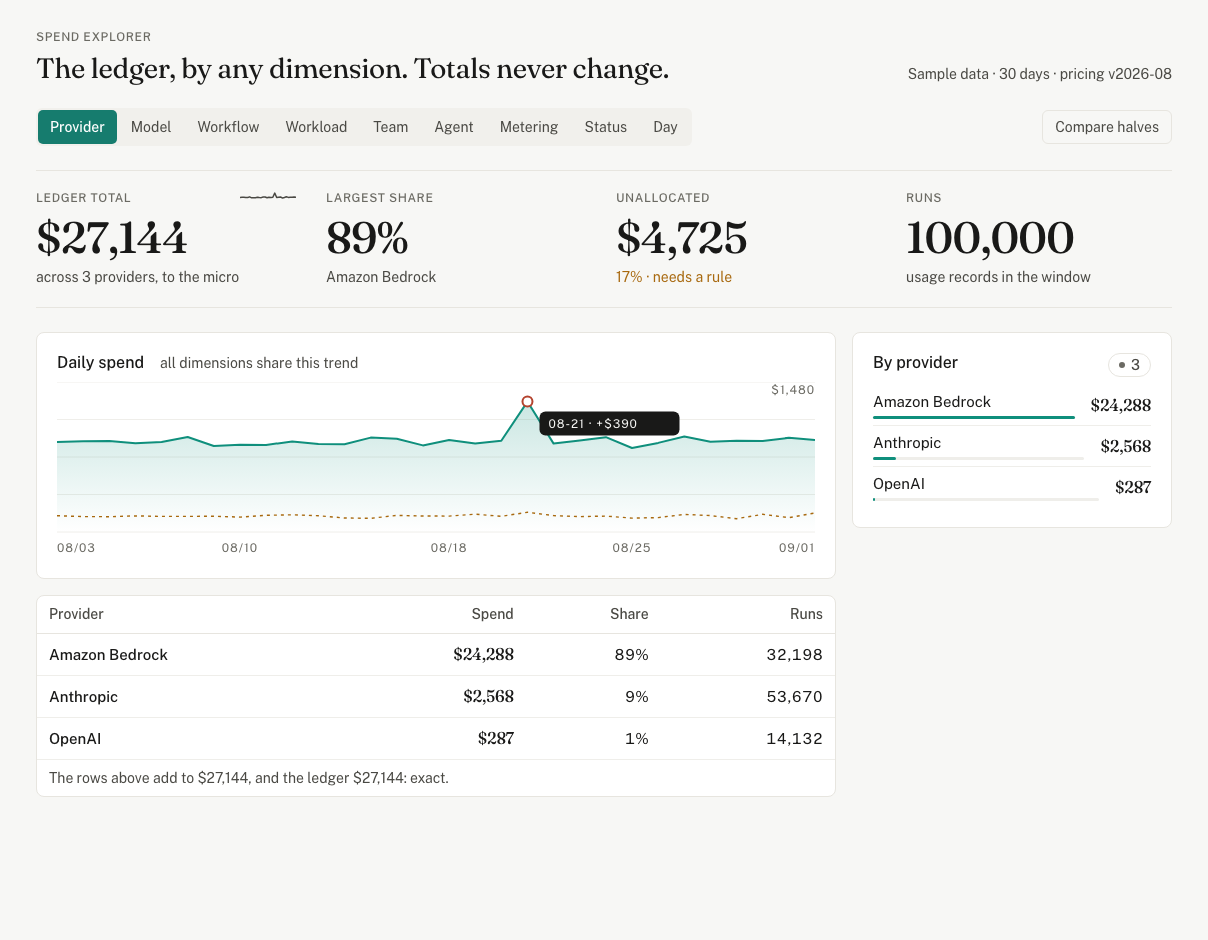
Every figure, and how it is computed
- Total
- The window's spend; the same total under every grouping.
- Change vs before
- This window against the equal window behind it, as a percentage, with the earlier total over its dates.
- Cost · Tokens · Requests · Cost + tokens
- The chart's measure; the last draws tokens as a line over the cost bars, so a rate change and a volume change read apart.
- Tokens by type
- Input, output and cached tokens with their cost, where the record was priced from tokens.
- Share
- A row's part of the total; the rows sum to it exactly or the page says so.
What you do here
- Switch the grouping in the table's tabs; the chart re-stacks.
- Export CSV from the head; it is the same rows.
The screen: app.valistry.ai/spend · Next: Attribution →