Overview
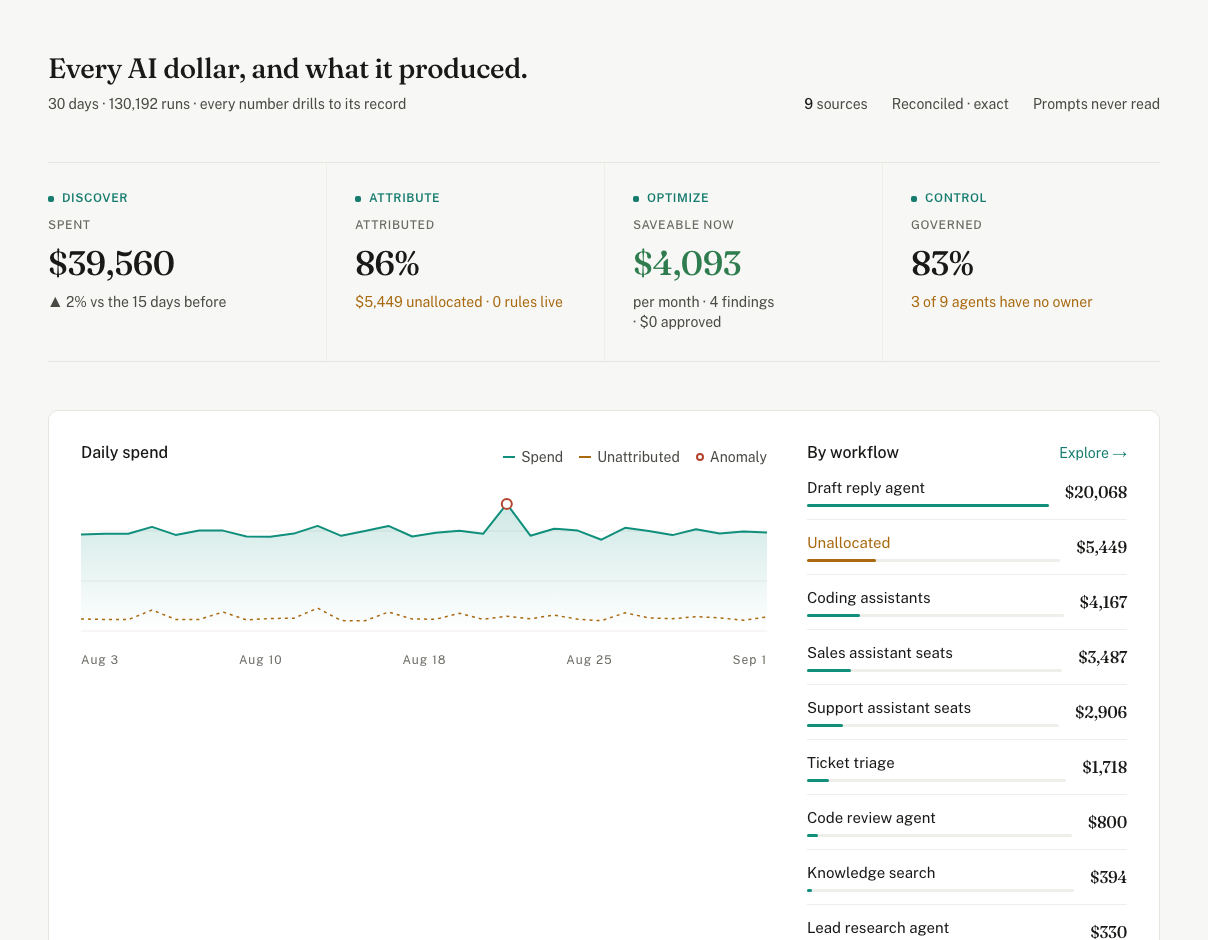
The estate on one screen: the total, coverage, what is realizable now, the governed share, the day-by-day chart with the spike ringed, and the three findings worth most.
Every figure, and how it is computed
- Total
- Every priced record in the window, summed in integer millionths of a dollar. Never sampled, never rounded until it is printed.
- Attributed
- The share of spend with a workflow or a team, from a tag, a published rule or the registry.
- Realizable now
- The findings that need no code — a rule, a cap, a flag, a seat — summed.
- Governed
- The share of spend under a policy that has an owner.
- At this pace
- The trailing week's daily rate times the days left in the month, added to the month so far. Labelled a projection.
- The spike
- A day more than a usual day by a fixed margin, ringed on the chart; the row under it names the workflow that carried it and how much was retries.
What you do here
- Read the three findings; each opens with its evidence.
- Ask a question in the bar; the answer is computed, never guessed.
- Widen the range from the top bar; every figure follows.
The screen: app.valistry.ai/overview · Next: Connect →